Like fallacies that lack evidence to support their claims, statistics are numbers or quantitative data that can be used to misrepresent a claim.
A common assumption we make when we see evidence represented as numbers is that numbers don't lie. While it is true that numbers themselves do not lie, the interpretation and presentation of numbers can be misleading or manipulated to create a false impression.
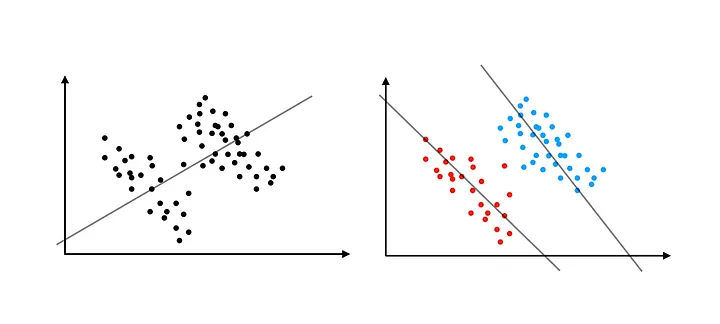
Source: Simpson's Paradox Explained by Alex Kolkena on YouTube
Simply stated, Simpson's Paradox is a phenomenon in statistics where a trend or relationship that appears in different groups of data, disappears or reverses when the groups are combined. It is a counterintuitive and sometimes misleading phenomenon that can occur when the data is not properly analyzed or interpreted.
Misleading statistics is when numerical data is used in a way that distorts or misrepresents the true meaning or significance of the numbers. They can be used intentionally or unintentionally to manipulate opinions, deceive people, or support a flawed argument. Here are a few examples of misleading statistics:
Cherry-picking: This occurs when only the data points that support a particular viewpoint or conclusion are selected, ignoring or excluding contradictory data. Focusing only on favourable data may misrepresent the true picture or trend.
Correlation vs. causation: Drawing conclusions based solely on correlation (a statistical relationship between two variables) without establishing a cause-and-effect relationship can be misleading. Just because two variables are associated does not mean that one directly causes the other.
Small sample sizes: Making sweeping generalizations based on a small sample size can lead to misleading conclusions. A small sample may not be representative of the larger population and can result in skewed or unreliable results.
Biased surveys: Surveys can be manipulated through leading questions, biased sampling methods, or selective reporting of results to achieve a desired outcome. If a survey is not conducted in a fair and unbiased manner, the statistics derived from it can be misleading.
Percentages without context: Presenting percentages without providing the relevant context can lead to misleading interpretations. For example, stating that a company's profits increased by 50% may seem impressive, but if the starting point was very low, the increase may not be significant.
Cumulative probabilities: Misleading statistics can arise from misinterpreting cumulative probabilities. For instance, assuming that if a certain event has a 1 in 10 chance of occurring, it will definitely happen after ten attempts. Each attempt retains the same probability, regardless of previous outcomes.
Key Takeaway: It's important to critically evaluate statistical information, consider the methodology used, and look for additional context to avoid falling prey to misleading statistics.
The University of Saskatchewan's main campus is situated on Treaty 6 Territory and the Homeland of the Métis.
© University of Saskatchewan
Disclaimer|Privacy